News & Notes
Stop worrying about “margin of error” – Worry about response rate
By: Peter Linett
December 02, 2019
It’s political polling season, which means lots of media stories about methodological social-science questions that are usually way too wonky for public consumption. (I know, I lost you at “polling.”)
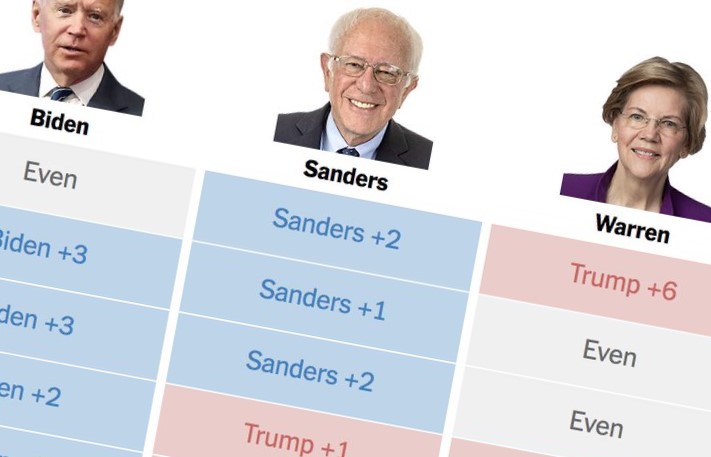
But if you work in audience research, those stories can grab your attention…and not in a good way. Last week I briefly became a distracted driver listening to an episode of The Daily about how a recent poll of swing-state voters was conducted. By the time I played the podcast, the results of this poll had already triggered a slew of articles and much anxiety among Democrats. Along with other polls, it was influencing the strategy conversation and thereby, potentially, the reality on the ground that later polls will measure.
But how solid was it? Here’s the exchange that made me a vehicular menace:
Michael Barbaro: …[I]t is striking just how hard it is to poll people. I mean, logistically, just a huge challenge to get people to answer the phone and then actually answer the questions.
Nate Cohn: Right. I would guess we made several hundred thousand telephone calls in order to get the 5,000 respondents that we ultimately received. … And it’s gotten much more difficult over the last few years.
That’s as close as we’re going to get to knowing the actual response rate for this poll, because it’s not listed in the report, even in the methodology appendix. And that’s true of most polls and many major national surveys. As if response rates don’t matter, and low response rates are merely a practical annoyance (“low productivity,” as that methodology section puts it).
Sure, they post the “margin of error,” which in this case is a respectable-sounding ±4.4 percentage points for most of the individual battleground states and only ±1.8 when the states are taken together.
But margin of error only takes into account sampling error, a narrow construct that doesn’t tell you anything about the quality of the data. All it tells you is whether the sample-size you’re analyzing is large enough to be plausibly representative of the total population you’re trying to characterize. Among other important things, it leaves out nonresponse bias, which is about whether the people who chose to participate in the survey are systematically different in some way from the people who chose not to.
Even if that difference is slight — just a tendency, some different mindset or lived experience — it can be significant when blown up to 5,000 respondents.
Going back to Cohn’s estimate, if we assume “several hundred thousand” means 300,000, then the poll had a response rate of 1.6%. In other words, 98.4% of the people they phoned didn’t participate. The people who decided to answer the questions are a tiny minority of the full response-base. That opens a huge door to nonresponse bias, since it’s entirely possible that that minority is different in some way from the much-larger group that didn’t participate. More patient or less busy? More polite? More political? Or just less defended via technologies like caller-ID? We don’t know. But if any such differences exist, and if those differences are tied even loosely to the content of poll (in this case, how people think, feel, and plan to behave politically), then the findings aren’t worth trusting.
And you can’t weight the sample for those kinds of possible skews, the way you can for education, race, and income. (That’s because we know how those demographic factors are distributed in the actual population. We don’t know how the relevant psychographic factors are distributed; we’re not even sure what they are.)
It’s easy to dismiss quickie political polls like this as “not real research.” Serious studies in healthcare, the economy, crime, and other domains spend time and money to ensure that a much higher proportion of potential respondents become actual respondents. They call back. They send email and snail-mail. If necessary, they visit you at home. Similarly, in corporate and some nonprofit and government research studies, they offer cash incentives to increase response rates. Those approaches can generate response rates way above single digits, even approaching 100 percent in some important, ongoing federal studies. And a 100 percent response rate would mean zero nonresponse bias.
Remember, that’s not 100 percent of the total population. Nobody’s talking about a census here (don’t get me started on the upcoming U.S. Census). It’s about working to ensure that the people you’re sampling are as likely to participate as possible, so that the resulting data is as representative of the population as possible. A huge sample size doesn’t mean much if that sample isn’t really representative — and you’ll never know that from the margin of error.
What are our response rates in our quantitative research for arts & culture organizations? It depends on the method and setting: Online surveys for a symphony orchestra or natural history museum, say, typically yield 5 – 25 percent response rates, the higher end of that range for more affiliated respondents like members and subscribers. (Incentives and reminder emails help.) On-site intercepts at a cultural institution or other public locations can generate rates of 50 to 80 percent. (You won’t be surprised to hear that we don’t do phone surveys these days.) Yes, there’s still some room for nonresponse bias, but we try to keep that doorway as narrow as possible — and well illuminated.
It’s not clear to me why political polling isn’t done more rigorously, given what’s at stake. Add that to the list of what keeps you up at night in these deeply divided times. Meanwhile, let’s keep trying to make cultural audience research and evaluation more inclusive and richly representative. There’s plenty at stake here, too.